Help Contents
| Our database is combination with gene and clinical information, how to use our database about 3 user cases below. | Search results page is consists of below tabs.(For MGeND data, the background color of the header is blue.) | |
| Search by | ||
Search by amino acid change in gene
-
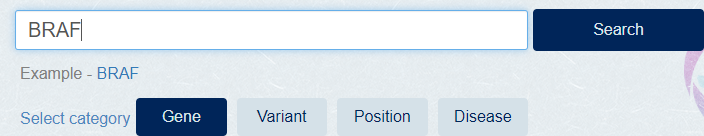
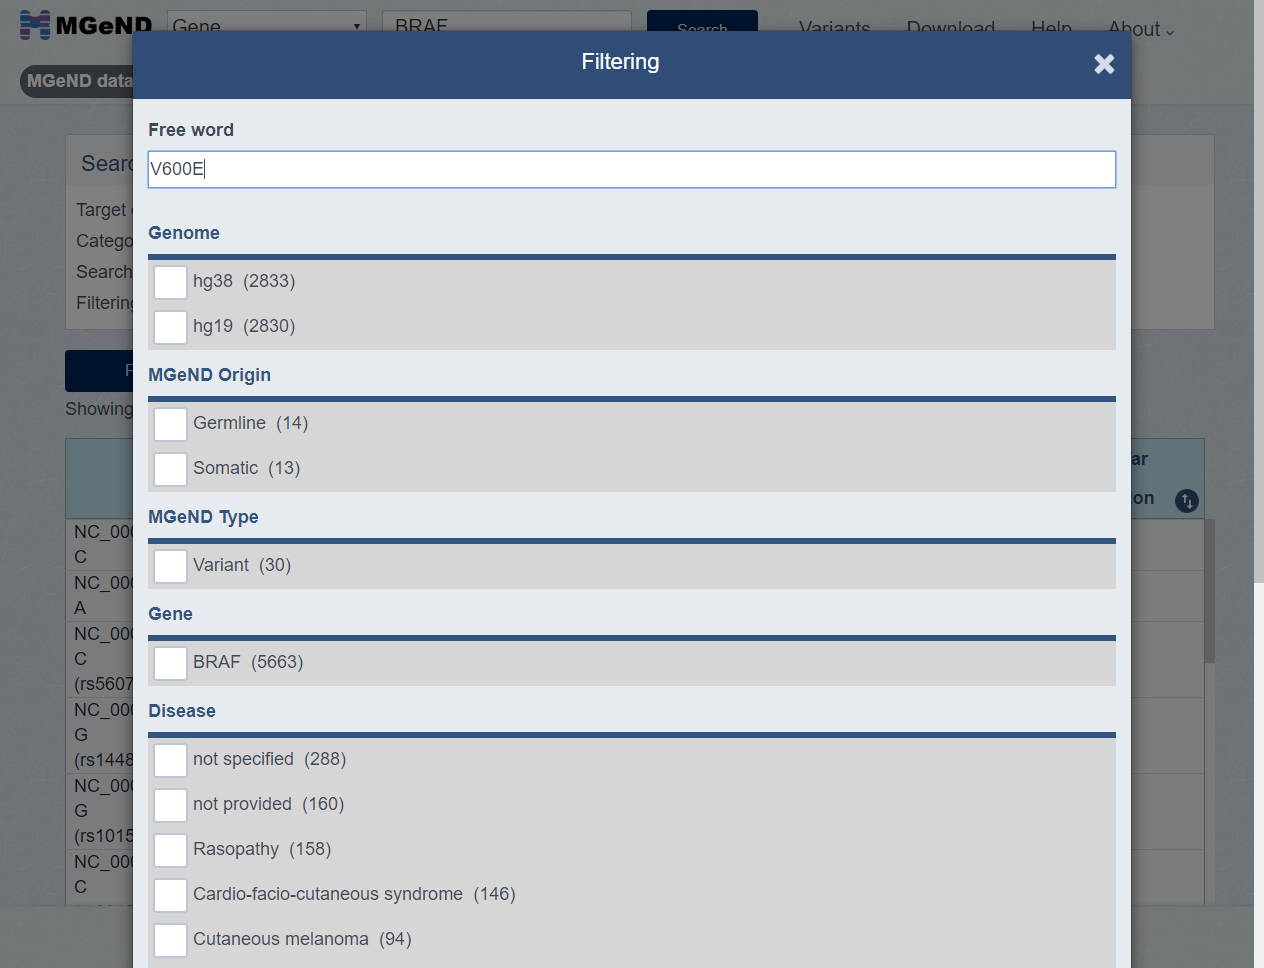
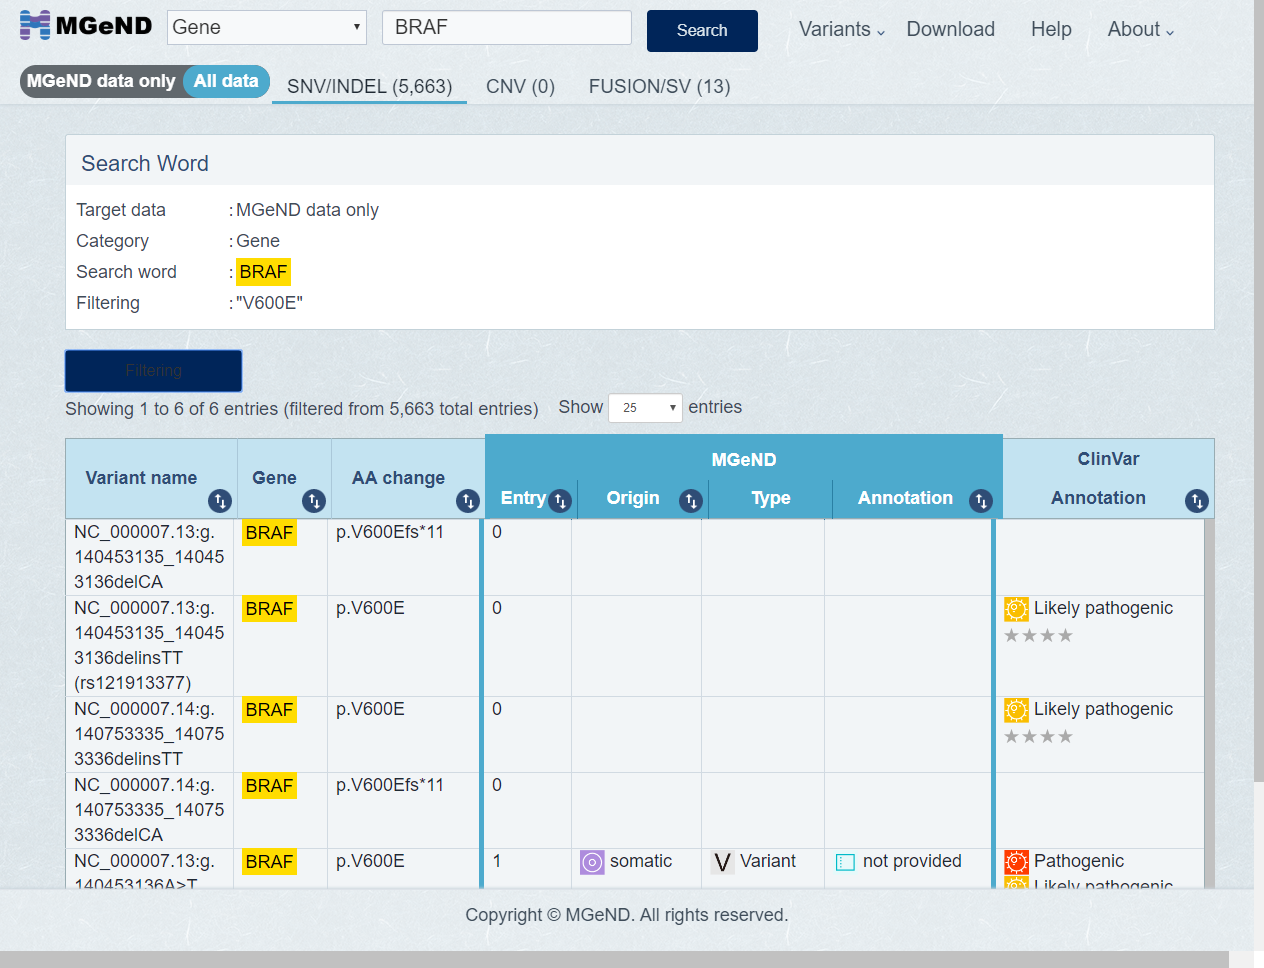
Select [Gene] category, Enter the gene name at search box and click [Search] button.
[Example] BRAF
-
Search results are shown as below. Result page is consists of 3 tabs. [SNV/INDEL], [CNV] and [FUSION/SV] tab are shown about variants.
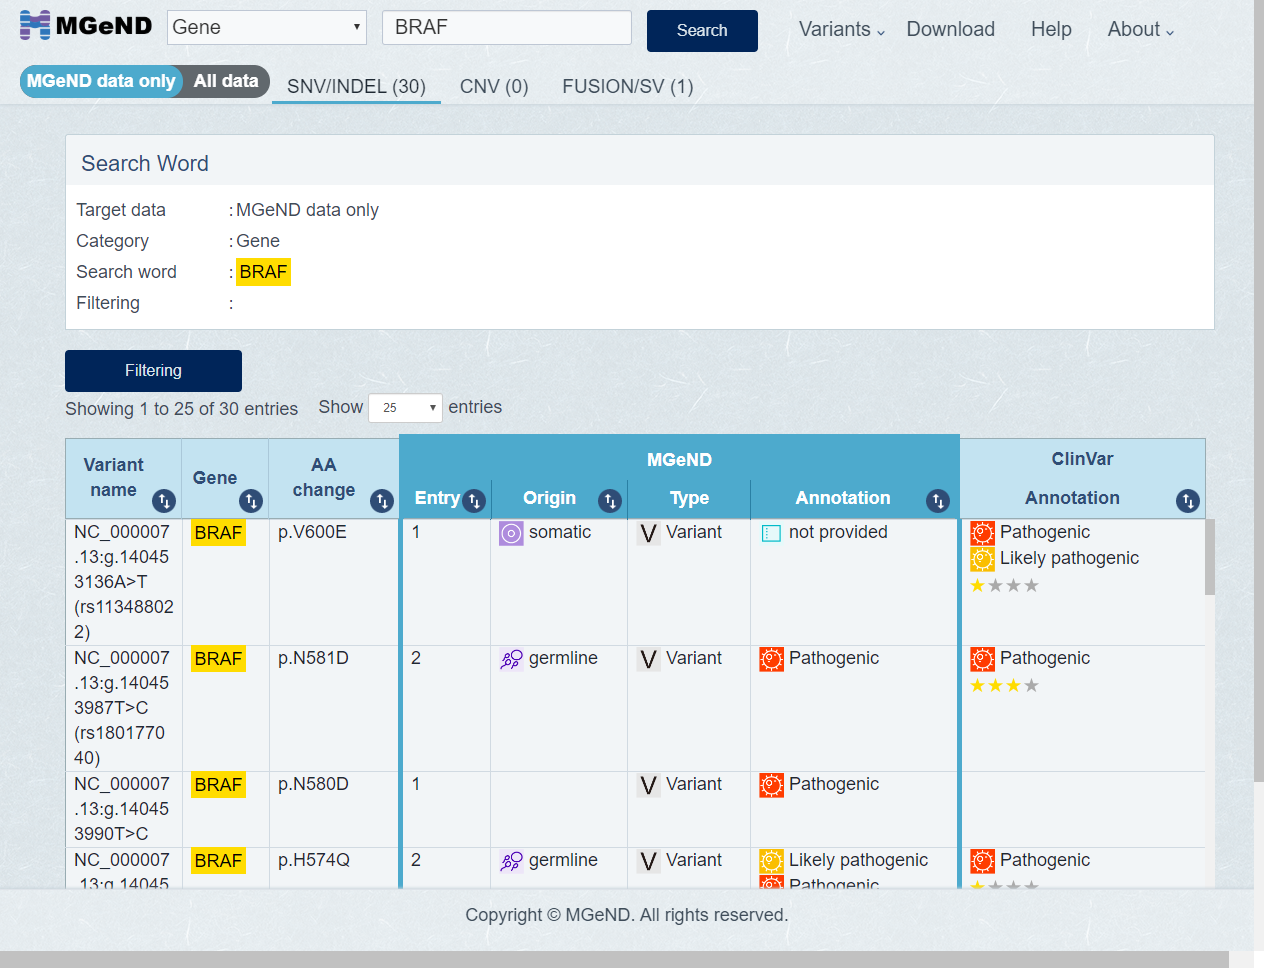
-
The first displayed varinats is MGeND data only. Select [All data] in display target variant if you want to display all variants.
-
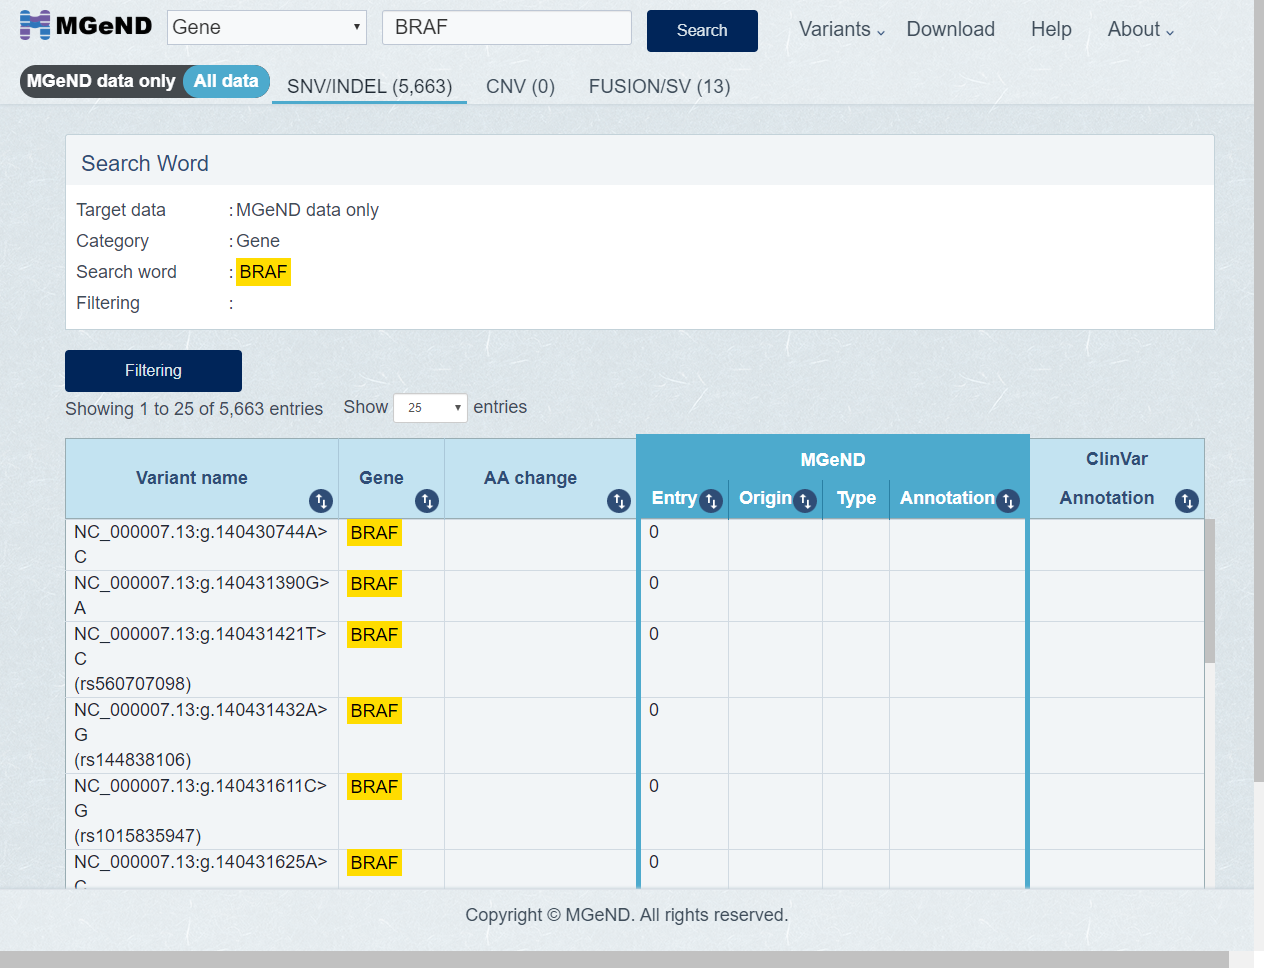
Click [Filtering] button if you want filter on the search results. Filtering dialog is shown.
Set the filter condition and click [Search] button.
-
Only entries which match the the filter condition [Example V600E] are shown.
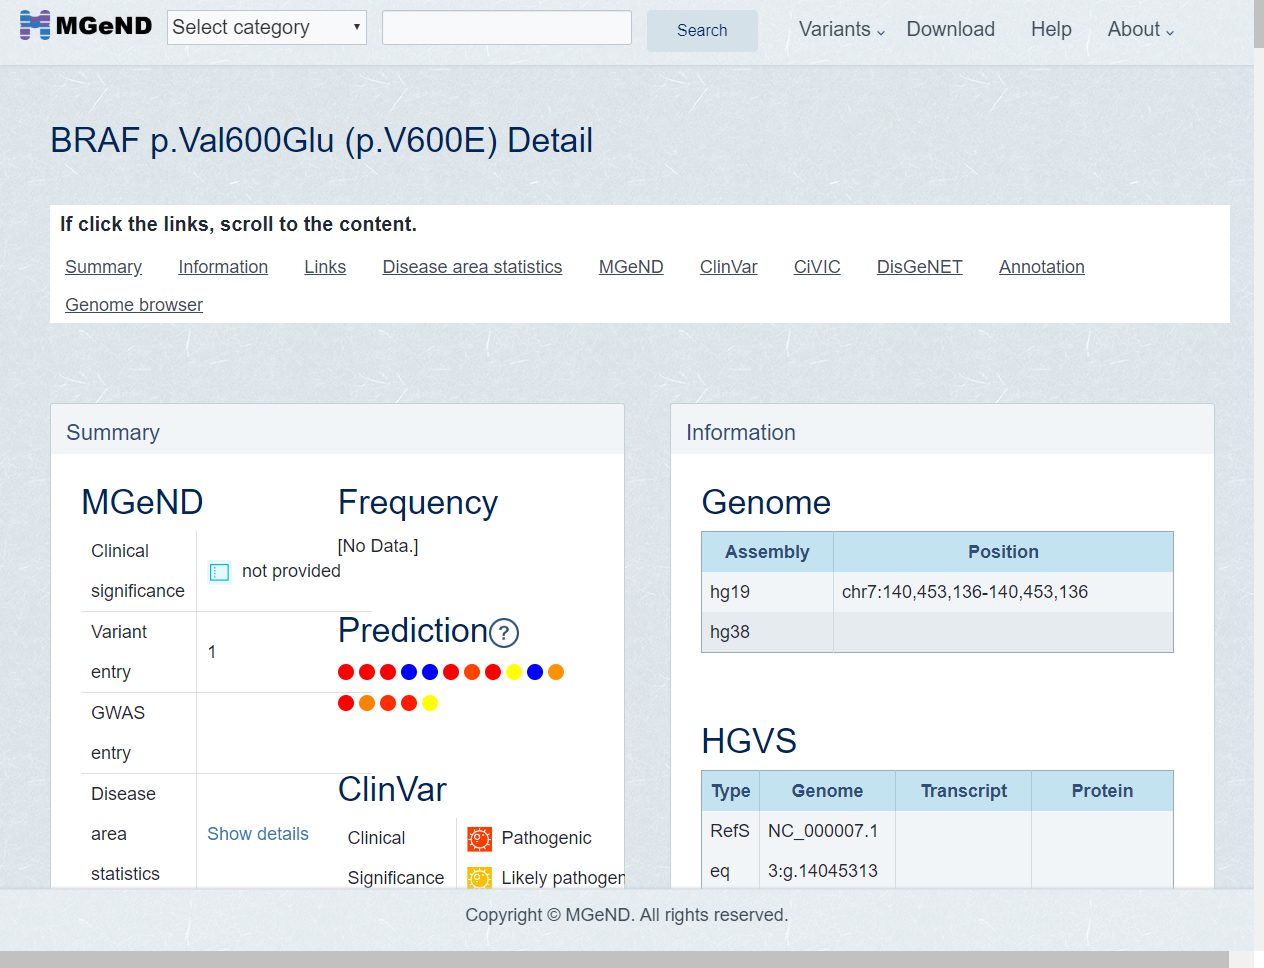
Click entry line if you want to show the detail variant information.
-
Information page about BRAF V600E is shown.
Search by position in chromosome
-
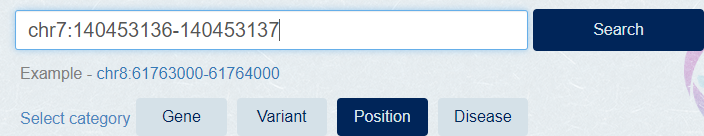
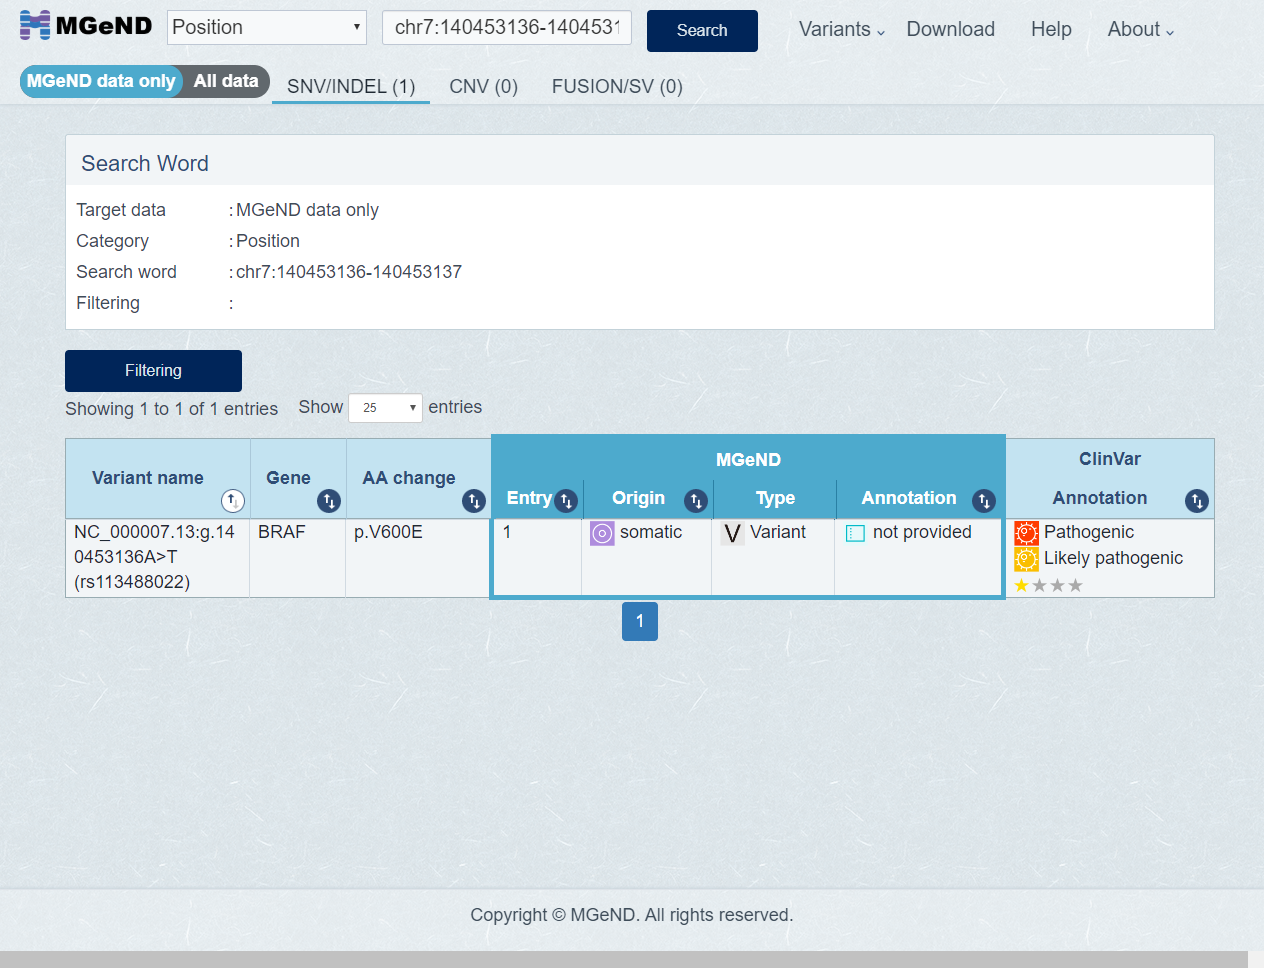
Select [Position] category, Enter the chromosome position at search box and click [Search] button.
[Example] chr7:140453136-140453137
-
Search result is shown.
Search by disease are on our database
-
Mouseover the [Variant] in header menu. Select the disease area name in sub menu.
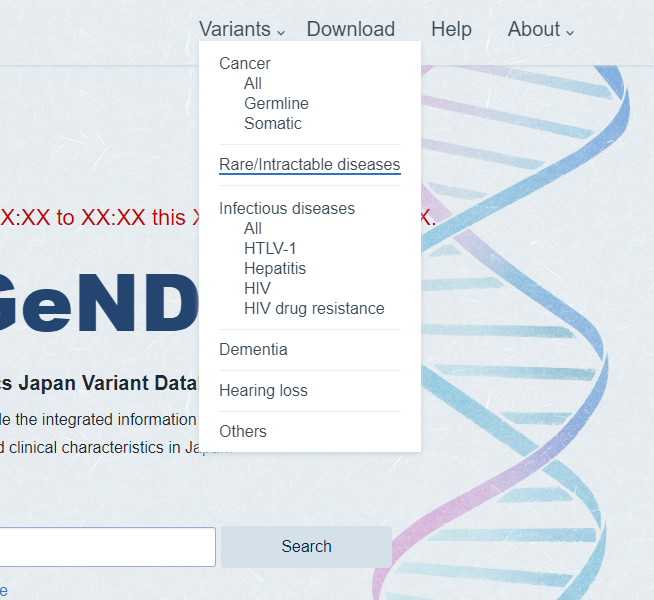
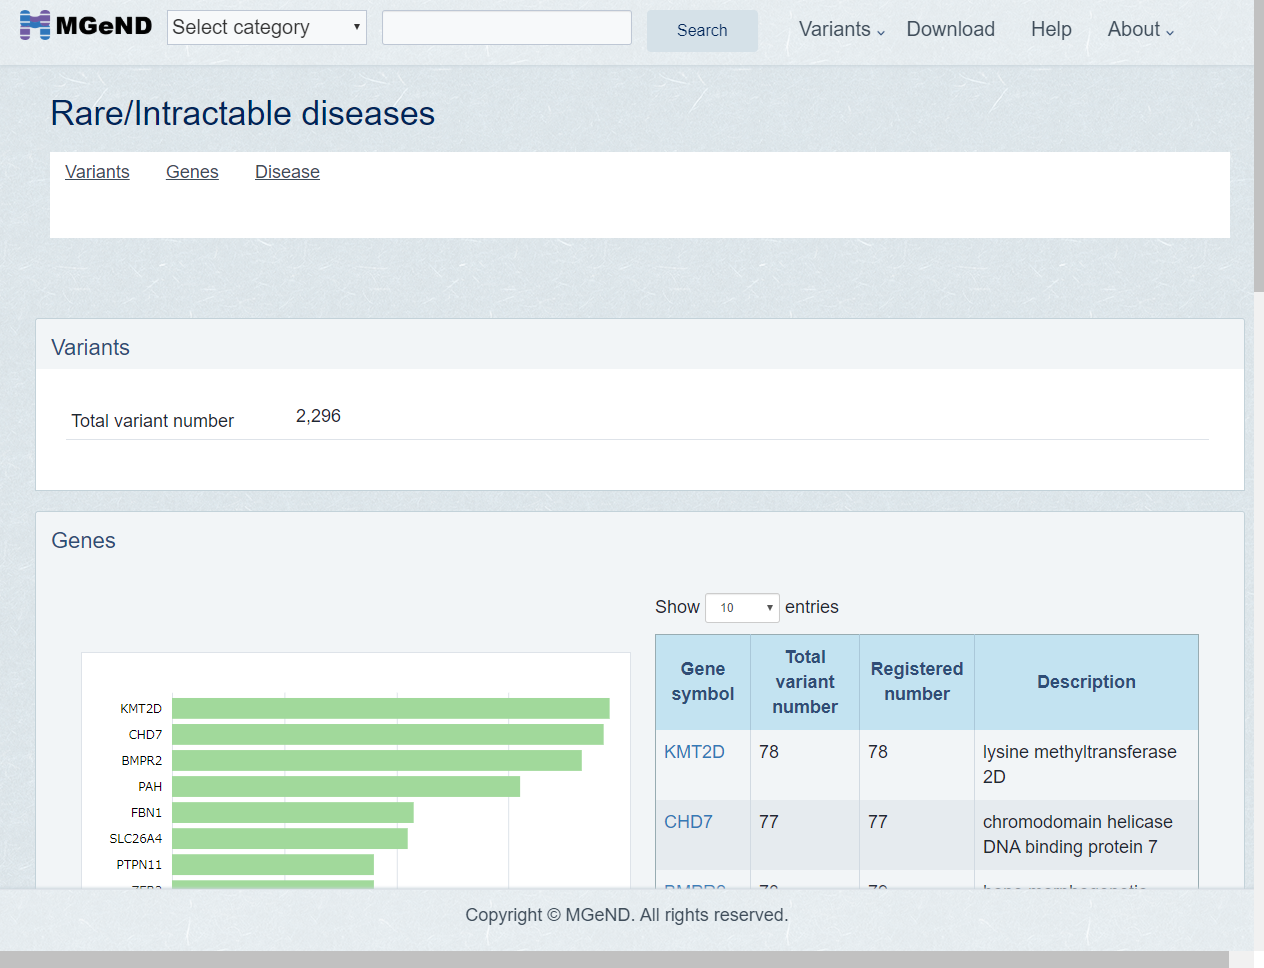
-
Disease area page is shown. Disease page is the list of gene and diseases which find in the disease are. Click gene or disease if you want to show the detail.
Search result
Search results page is consists of below tabs.(For MGeND data, the background color of the header is blue.)
-
SNV/INDEL
Column Summary Variant name Show variant name. Gene Show Entrez Gene symbol. AA change Show AA change. MGeND Entry Show entry of MGeND(total numerator). MGeND Origin Show allele origin of MGeND. MGeND type Show provided source data type of MGeND. MGeND annotation Show clinical significance of MGeND. ClinVar annotation Show clinical significance and rank star of ClinVar. -
CNV
Column Summary Name Show variant name. MGeND Entry Show entry of MGeND(total numerator). MGeND Origin Show allele origin of MGeND. MGeND type Show provided source data type of MGeND. MGeND annotation Show clinical significance of MGeND. Type Show variant type. Size Show variant size(stop -start + 1). Chromosome Show chromosome. Start Show start position. Stop Show stop position. Ref Show reference allele. Alt Show alternate allele. ClinVar Show clinical significance and rank star of ClinVar. -
FUSION/SV
Column Summary Name Show variant name. MGeND Entry Show entry of MGeND(total numerator). MGeND Origin Show allele origin of MGeND. MGeND type Show provided source data type of MGeND. MGeND annotation Show clinical significance of MGeND. Type Show variant type. Gene symbol Show Entrez Gene symbol. Chromosome Show chromosome. Genomic start Show start position. Genomic stop Show stop position. Strand Show strand. Ref Show reference allele. Alt Show alternate allele. ClinVar Show clinical significance and rank star of ClinVar.
Icon
Impact (SnpEff)
| HIGH | |
| MODERATE | |
| LOW | |
| MODIFIER |
Evidence Type (CIViC)
| Predictive | |
| Diagnostic | |
| Prognostic | |
| Predisposing |
Variant Origin
| Biparental | De novo | ||
| Germline | Inherited | ||
| Maternal | Not applicable | ||
| Origin not provided | Paternal | ||
| Somatic | Tested inconclusive | ||
| Uniparental | Unknown |
Clinical Significance
| Pathogenic | Likely pathogenic | ||
| Likely benign | Benign | ||
| Adverse response | Affects | ||
| Association | Association not found | ||
| Better outcome | Conflicting data from submitters | ||
| Conflicting interpretations of pathogenicity | Drug response | ||
| NA | Negative | ||
| Not provided | Other | ||
| Poor outcome | Positive | ||
| Protective | Resistance or non response | ||
| Risk factor | Sensitivity | ||
| Uncertain significance |
Evidence Direction (CIViC)
| Supports | |
| Does not support |
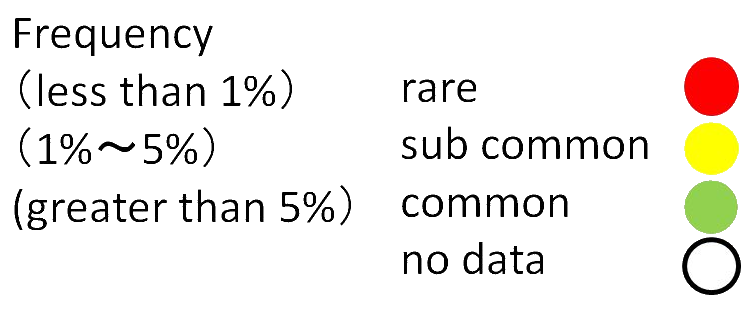
Frequency
Frequency is minor allele frequency associated with Japanese. (HGVD, ToMMo, ExAC_EAS, NCBN, NCBN(Hondo), NCBN(Ryukyu)).
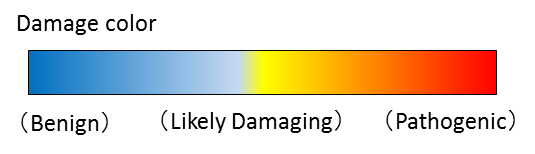
Prediction
Each dot indicates estimating scores predicted by the bioinformatics prediction tool.
The predicted scores by the following algorithms are obtained from dbNFSP database [1]:
The color of the dot indicates the predicted result, with red indicating more impact on the molecule.
[1] Liu X, Jian X, and Boerwinkle E. Human Mutation. 32:894-899. 2011
[2] Kamada, M., Takagi, A., Kojima, R. et al., bioRxiv 2021.07.15.452566; doi: https://doi.org/10.1101/2021.07.15.452566
The predicted scores by the following algorithms are obtained from dbNFSP database [1]:
LRT(EC), SIFT(EC), FATHMM(EC), MetaLR(ES), MetaSVM(ES), PROVEAN(AL), GERP++, Realiability_index, fitCons, PhyloP 100(NC), PhyloP 20(NC), GenoCanyon, FATHMM-MKL, Eigen-PC, MutationAssessor(EC), MutationTaster2(PS)
PathoGN is a prediction algorithm developed by Department of Biomedical Data Intelligence, Kyoto University [2]The color of the dot indicates the predicted result, with red indicating more impact on the molecule.
[1] Liu X, Jian X, and Boerwinkle E. Human Mutation. 32:894-899. 2011
[2] Kamada, M., Takagi, A., Kojima, R. et al., bioRxiv 2021.07.15.452566; doi: https://doi.org/10.1101/2021.07.15.452566
Statistics
GWAS
The GWAS data published in this database excludes any results with a p-value greater than 1e-4 (0.0001), as these are considered not statistically significant. This threshold has been set to ensure the significant of the associations and provide users with meaningful information.
The GWAS data published in this database excludes any results with a p-value greater than 1e-4 (0.0001), as these are considered not statistically significant. This threshold has been set to ensure the significant of the associations and provide users with meaningful information.
Statistics use age range table and/or sex table below.
| Age range |
|---|
| 0-9 |
| 10-19 |
| 20-29 |
| 30-39 |
| 40-49 |
| 50-59 |
| 60-69 |
| 70-79 |
| 80-89 |
| 90-99 |
| 100- |
| children (0-10) |
| adolescents and young adults (11-20) |
| adults (21-60) |
| elderlies (60<) |
| unknown |
| not provided |
| Other |
| Sex |
|---|
| male |
| female |
| mixed gender |
| unknown |
| not provided |